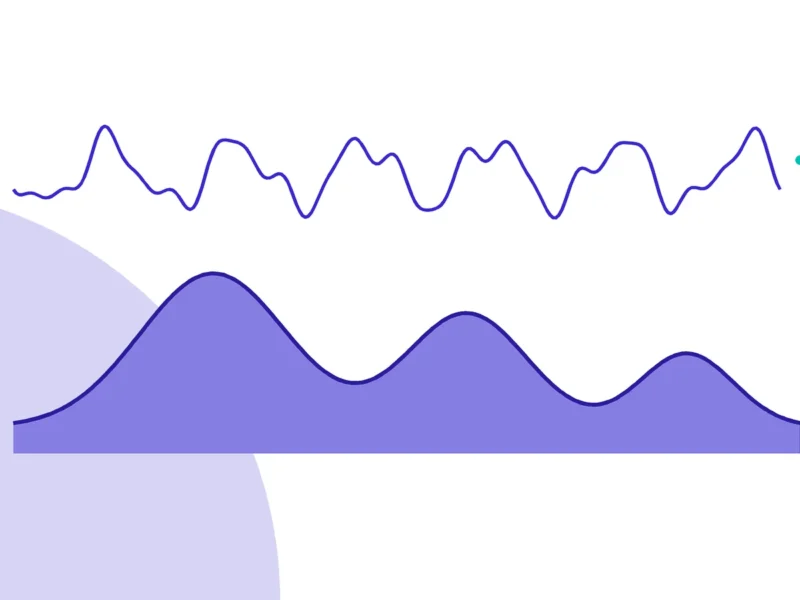










A teacher with a trained ear can hear within seconds whether a voice sounds breathy, whether there’s tension, whether the vibrato is even. But pointing exactly at where that is, at a specific instant, is a lot harder. That’s where the spectrogram comes in: your voice, turned into an image you actually can point at.
CajaConcepto — A photograph of sound over time
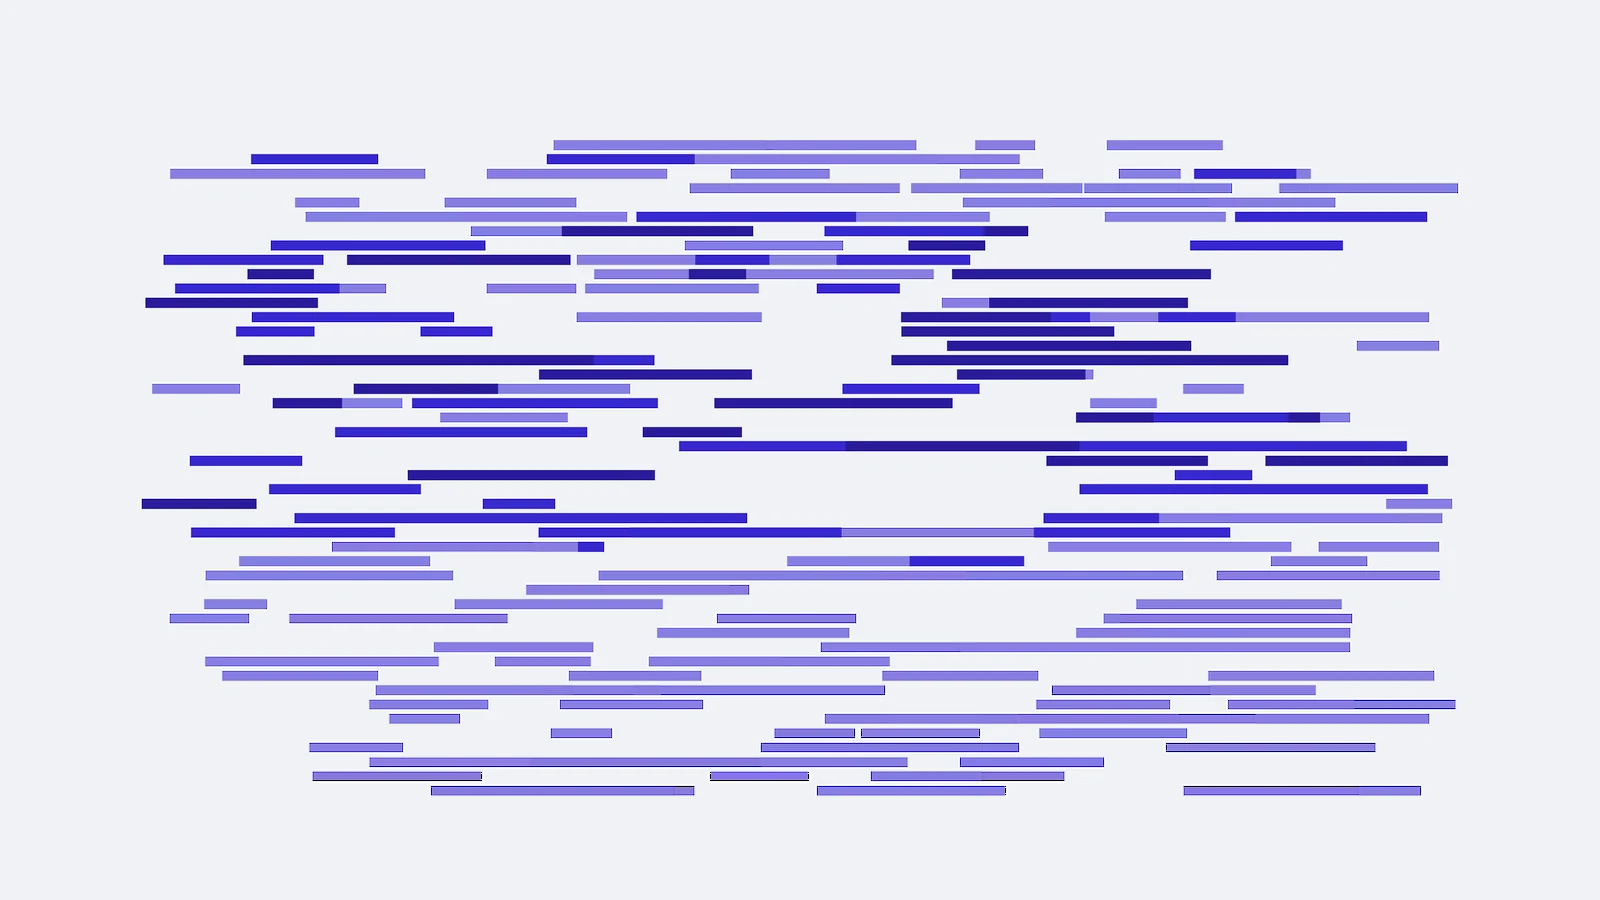
A spectrogram is, literally, a photograph of sound across time. The horizontal axis is time; the vertical axis is frequency; and color or intensity represents how much energy there is at each frequency, at each instant.
How to read it, no expertise required
You don’t need technical training to start reading a spectrogram; these four keys already get you most of the way:
- Horizontal lines are the harmonics: the fundamental and its multiples, stacked one on top of the other.
- The darker or brighter bands crossing those lines are the formants: the zones where the vocal tract is reinforcing energy.
- The “haze” between the lines, a blurry area with no clean edges, is noise: air escaping without turning into organized vibration.
- A sudden jump across all the lines at once is a crack or break; a smooth, regular ripple in the lines is vibrato.
Why this matters for a singer
Acoustic tools don’t “hear better” than a trained ear: they make visible something that ear already perceives but can’t pin down precisely. A teacher might say “that sounded breathier there”; a spectrogram can show exactly which second and which frequency band that “haze” happens in. That combination, the ear that interprets and the image that locates, is what makes it possible to compare two singing sessions objectively, instead of relying entirely on auditory memory. That’s, at its core, the idea VoiceScan is chasing: helping you see what your teacher already hears.
A tool, not a verdict
A spectrogram is a representation of what’s happening acoustically at a given moment: it shows, with visual data, the energy at each frequency, without saying whether a voice is “good” or “bad”. Interpreting that image, whether that “haze” is a problem to fix or simply the natural color of a voice in that style, still requires the judgment of a trained ear. The tool and the teacher don’t compete: they complement each other.
From the image to the work session
Where this tool’s usefulness really shows isn’t in a single snapshot, but in comparing several: the same phrase sung today and again in a month, for example. That’s where the spectrogram stops being a technical curiosity and becomes a real record of vocal progress: you don’t have to rely entirely on the memory of how it sounded “before”, because there’s a concrete visual reference to compare against.
CajaPruébalo — A minute with your own voice
Find any free spectrogram app on your phone. Sing a sustained note, first very breathy, then the same note clean and centered. Look at the difference: in the breathy version you’ll see more “haze” between the harmonic lines; in the clean one, much sharper lines.
Glosario
- Spectrogram — a visual representation of a sound over time, showing frequency and energy.
- Frequency — the number of vibrations per second of a sound wave; determines the pitch we perceive.
- Energy — the intensity of a specific frequency at a given instant.
- Vibrato — the regular, periodic oscillation of a sustained note’s frequency.
- Noise — sound energy without organized harmonic structure, like air escaping without vibrating.
Keep reading
Want to see the spectrogram and zone map of your own voice? Analyze your voice →